Reliability planning in U.S. supply chains integrates predictive analytics, real-time visibility, and contingency strategies to achieve 95%+ on-time delivery (OTD), slashing delays costing $1.5T annually amid port congestion and driver shortages per BTS data.
Tools like TMS and AI forecast disruptions, optimizing routes and inventory to cut dwell times from 5.2 to under 3 days, as seen in J.B. Hunt’s 24% OTD gains. FMCSA’s SMS tracks carrier performance, ensuring compliance while adaptive planning builds resilience against tariffs, weather, and strikes.
Predictive Analytics and Risk Forecasting
AI platforms analyze historical data, weather, and geopolitics to predict delays 7-14 days ahead, enabling rerouting or backups—Toyota’s diversification post-disasters resumed production faster than peers. U.S. firms use scenario modeling for 20-30% delay reductions, prioritizing high-value loads via real-time ETAs.
Real-Time Visibility and Tracking
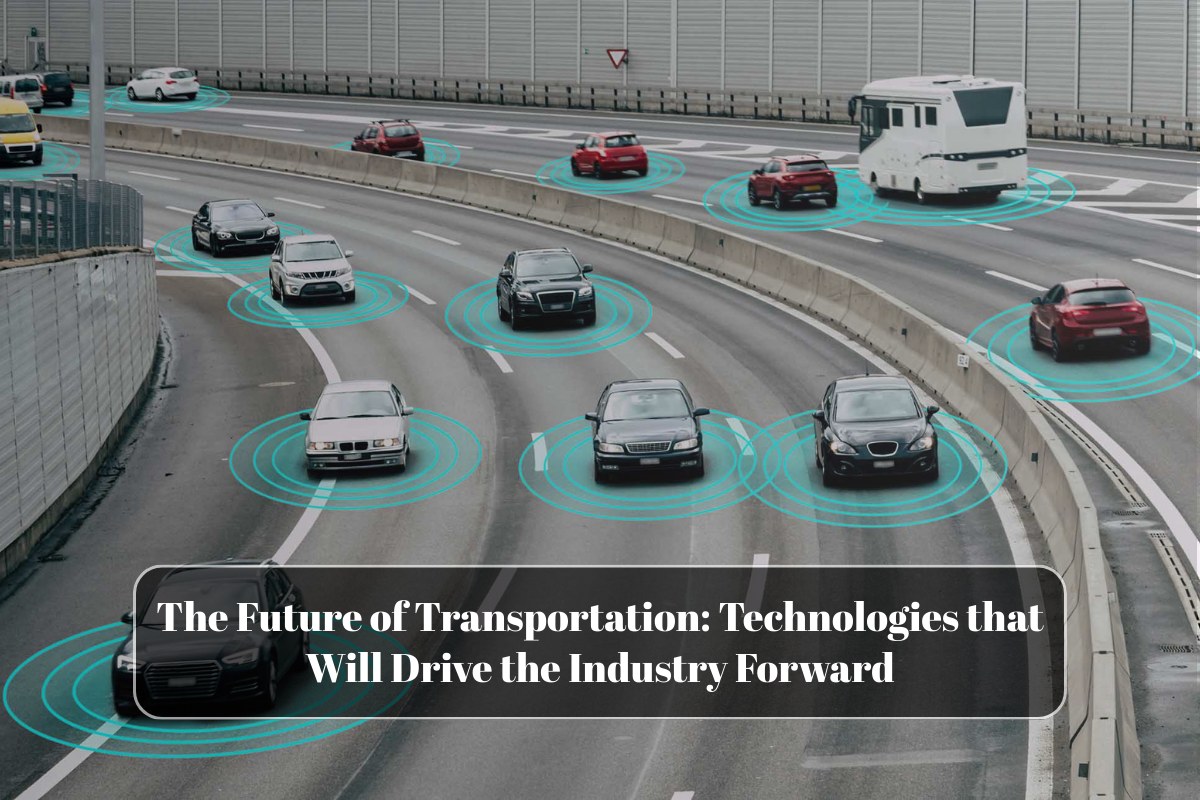
Telematics/GPS provide end-to-end monitoring, alerting on issues like tire pressure or traffic for proactive fixes—preventive maintenance cuts breakdowns 78%. Centralized dashboards sync TMS/WMS, boosting first-attempt success 42% and OTIF to 95%+.
Route Optimization and Load Planning
Dynamic scheduling factors capacity, dock availability, and regulations, reducing empty miles 15-25%; FMCSA-vetted carriers ensure safety scores correlate to 91% OTD. Multi-modal shifts (rail/water) leverage 65%/40% spare capacity amid truck shortages.
Contingency and Supplier Diversification
Backup suppliers and nearshoring cut lead times 50%; Walmart’s emergency logistics post-disasters restored chains swiftly via pre-positioned stock. Standardized KPIs like buffer index and route adherence ensure accountability across channels.
Technology Integration for Execution
Cloud TMS/EDI automate docs, cutting errors 70%; e2open-style platforms yield $9.2M synergies via unified data.
Challenges and Best Practices
Silos? Cross-functional teams; driver shortages? Incentives/training per FMCSA. Regular audits sustain 85% utilization.
Measuring and Sustaining Reliability
Track OTIF, TTI, PMT via dashboards; ROI hits 2-3x in 2 years through cost savings and loyalty.
FAQs
1. What KPIs define reliability?
OTD/OTIF (95%+), route adherence, first-attempt success per FarEye standards.
2. How does AI prevent delays?
Forecasts 7-14 days ahead; 20-30% reductions via scenarios.
3. FMCSA’s role in commitments?
SMS scores vet carriers for 91% OTD correlation.
4. Multi-modal benefits?
Spare capacity cuts costs 15-25%; resilience to shortages.
5. ROI timeline?
2-3 years; $2.1M/year from uptime alone.